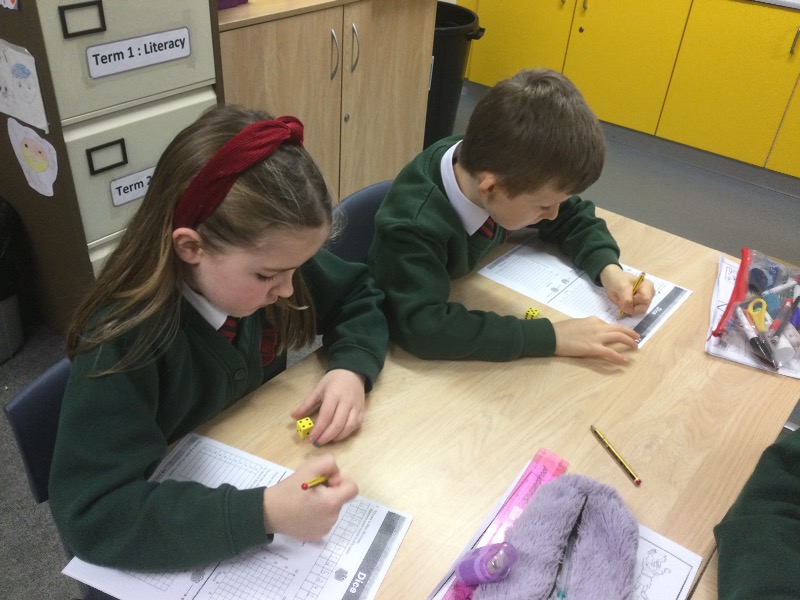
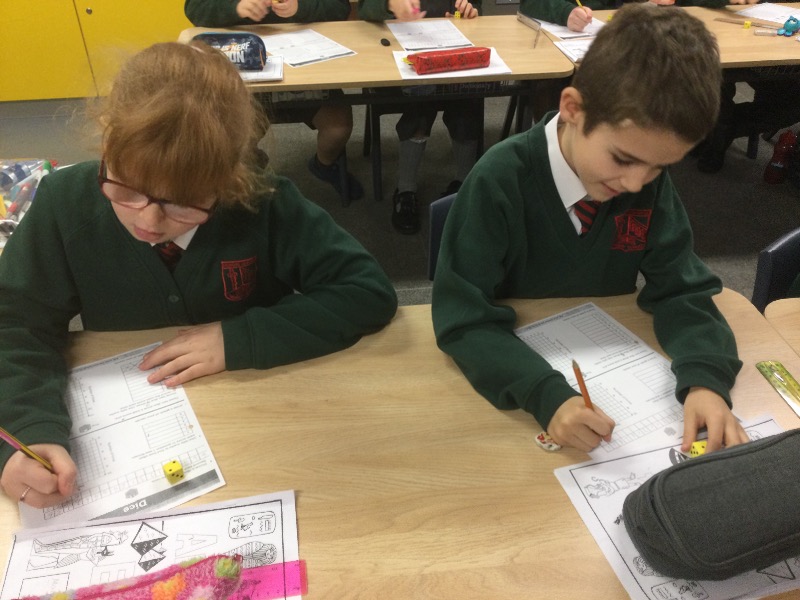
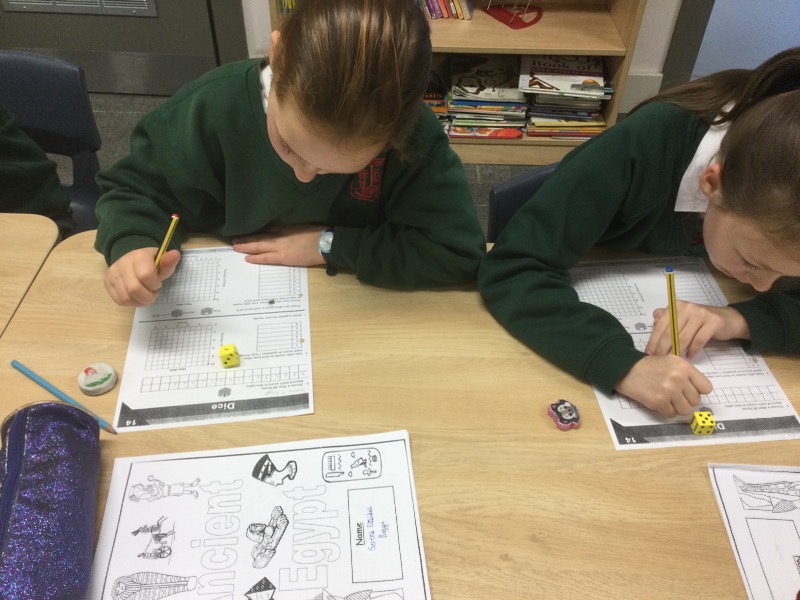
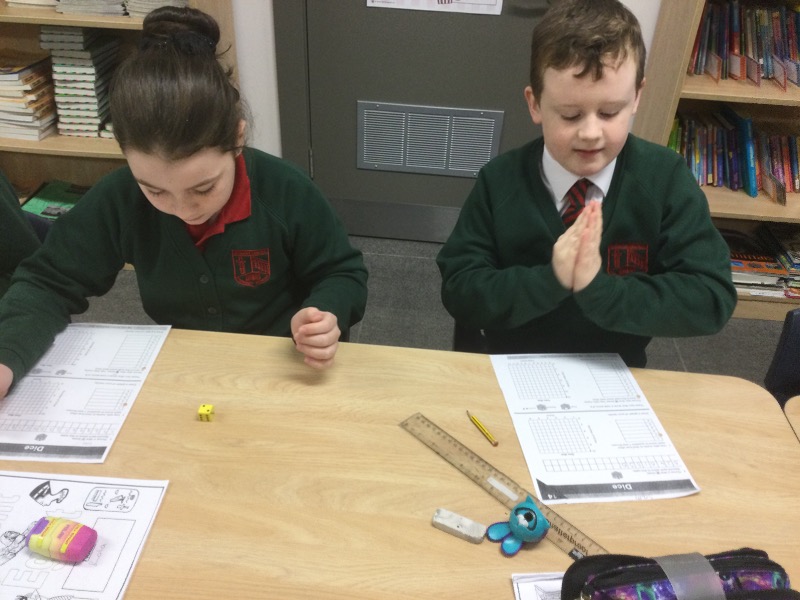
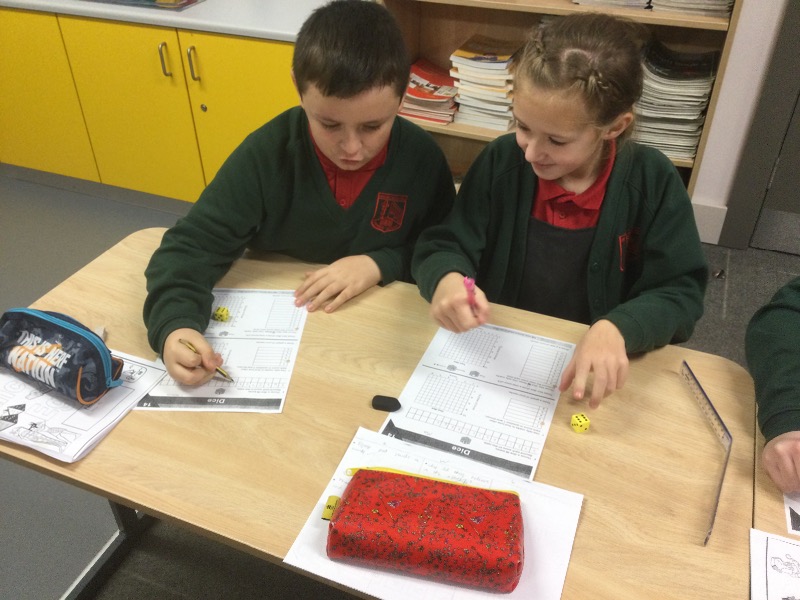
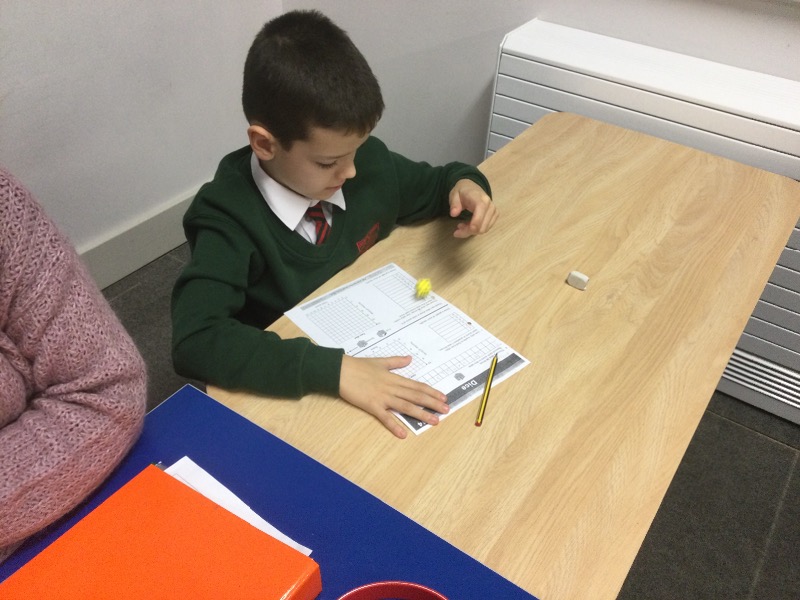
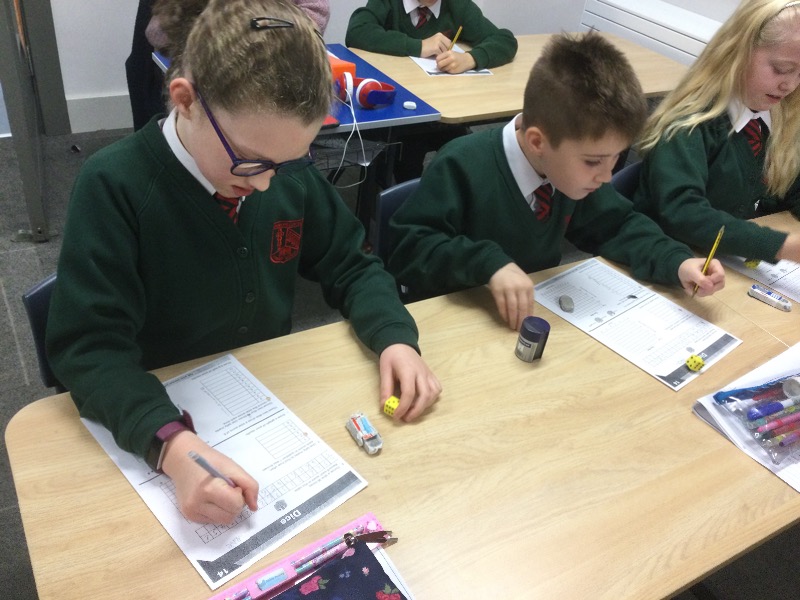
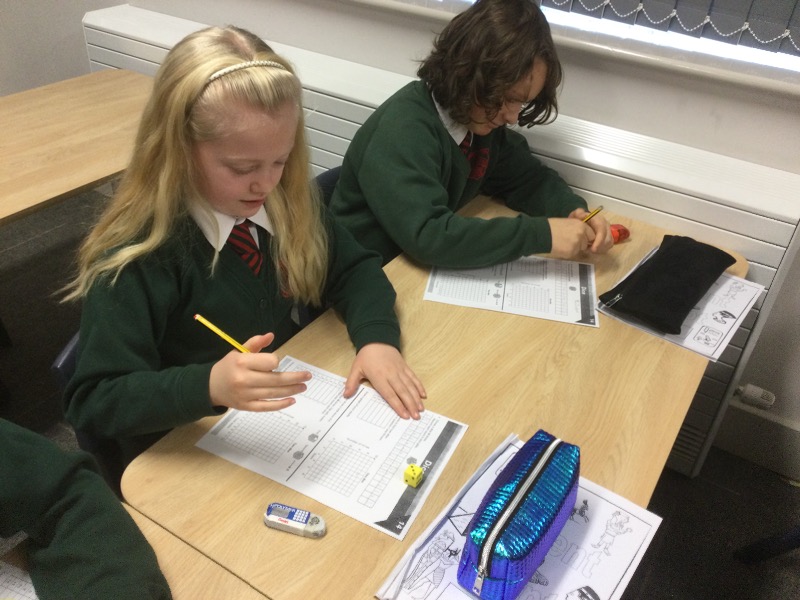
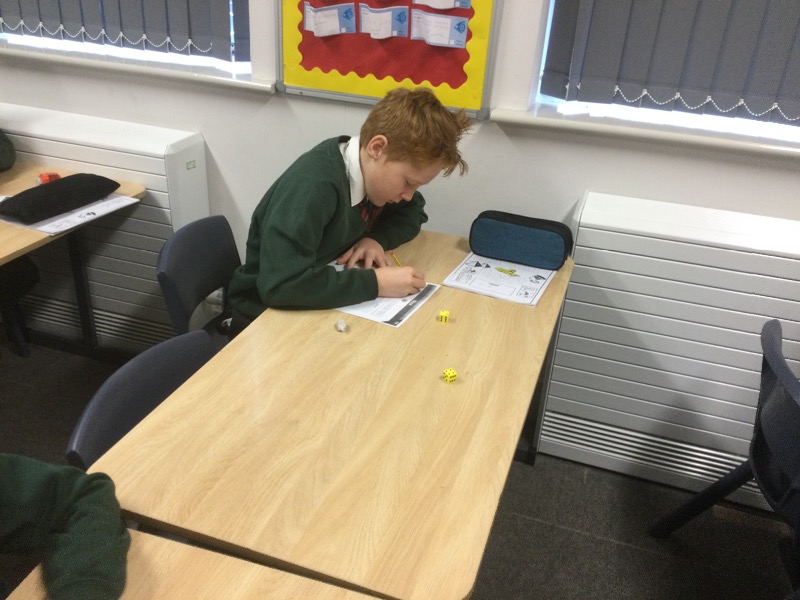
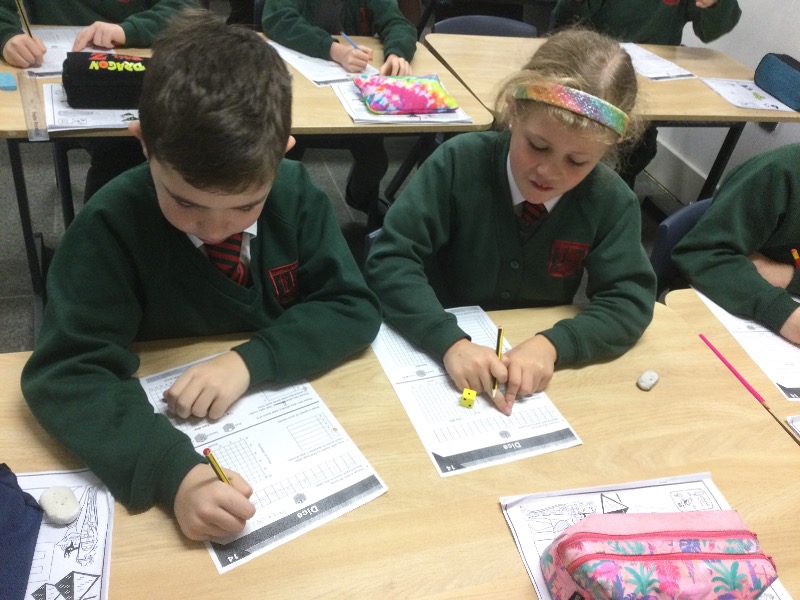
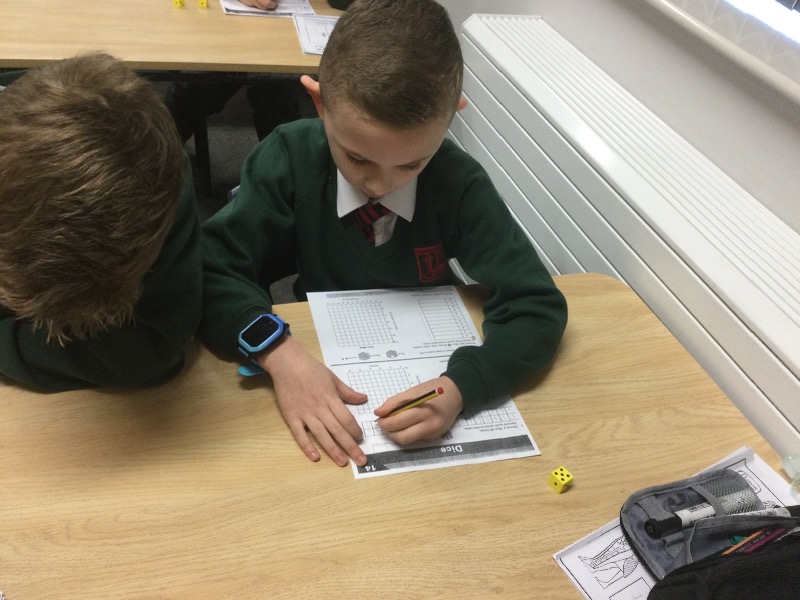
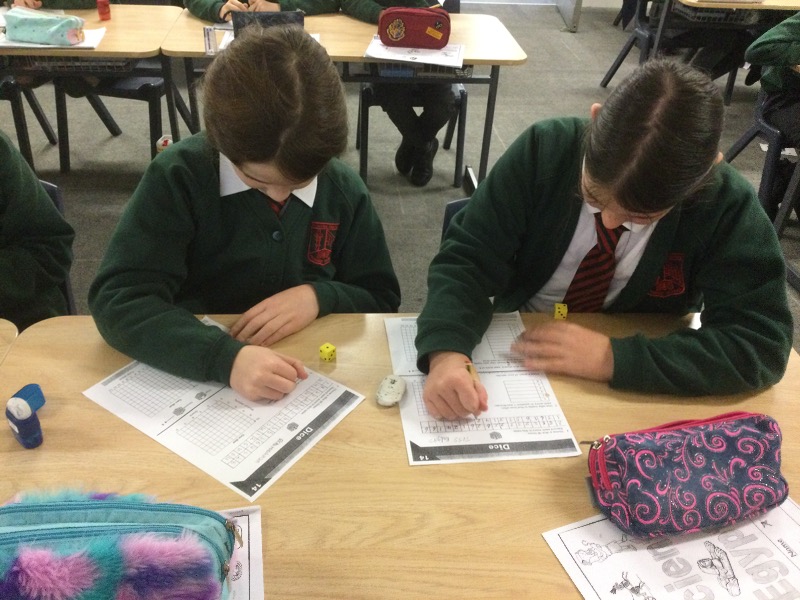
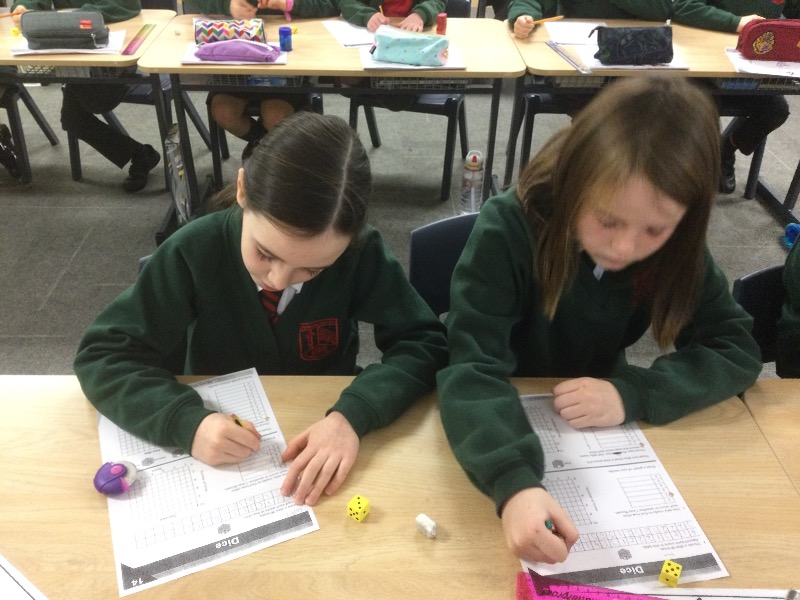
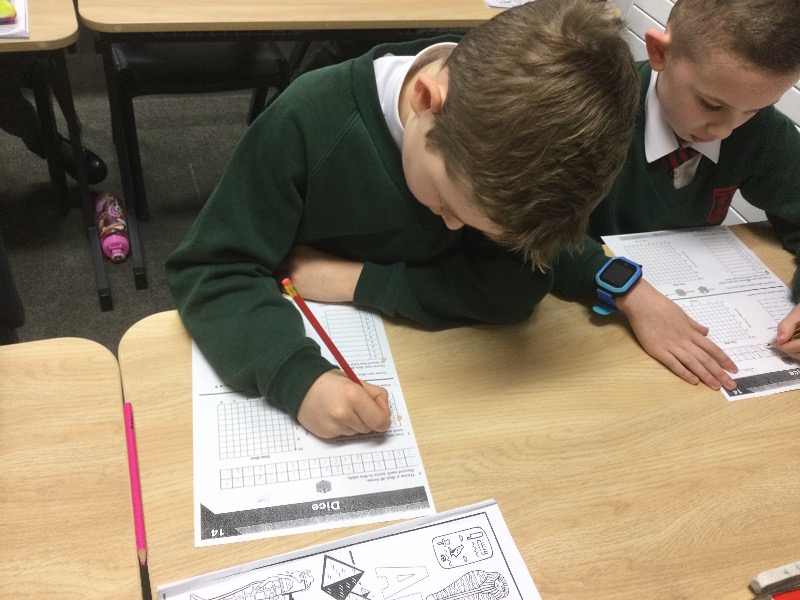
We have been looking at tally charts, pictograms and bar graphs.
Data has been collected and represented in tally charts, vertical and horizontal pictograms and bar graphs.
Pupils have been encouraged to discuss and interpret various graphs in class.
Here are a few photos of us enjoying a dice game challenge where we had to record our results in a tally chart and then transfer our scores in a bar graph.